How do My plant and the Weather lab connect?
Start at your plant. Then look at the same day in the Weather lab. Then compare them.
- 01 · FIELDNotice & predict
Keep what you saw and explain what you think might happen.
- 02 · SIMULATIONLook at the same day
Go to the same day in 2025 and answer the same questions.
- 03 · FIELDReturn & revise
Look at the same plant again. Compare your evidence with your prediction.
Field records and model output are different evidence. Opening the other activity keeps this tab in place; it does not move your records.
Learn · Practice notebook
Weather lab
The earlier Weather lab. Your saved runs and practice notes stay here. For step 2, use the Weather lab.
- 15 min
- Needs nothing
- °C and °F
Open My plant alongside ↗ (opens in a new tab)Student & teacher guideSources
Practice notebook · illustrative records, separate from field work.
NOAA station, PHL airport (USW00013739). Daily observations at Philadelphia International Airport. Source: NOAA NCEI GHCN-Daily, Menne et al. 2012, doi:10.7289/V5D21VHZ.
Weather stage
Weather in motion.
- Observed · NOAA weather, AirNow
- Model · a teaching model, not a measured plant
- Art · plant and weather visuals

A life coming into view…
Date held · the sky keeps its own time; Less motion in the header stills it.
Teaching model not measured
- Root-zone water bucket
- 119.6 of 120 mm
- Leaf canopy
- 0%
Airport record measured
- Wind
- 7.3 m/s
How the data shapes this scene
One selected date links the airport weather, preliminary Philadelphia monitor AQI and teaching plant model. Backdrops, sky hours and particle motion are visual cues.
| Parameter | Selected value | Source | What you see |
|---|---|---|---|
| Temperature | 3.9 °C to 10.0 °C; midpoint 7.0 °C | NOAA airport | Cool edge light or warm heat waves; scene badge shows the scenario midpoint. |
| Rain | 0.0 mm | NOAA airport | Layered falling drops and small impacts. The daily total does not tell us when it rained. |
| Wind | 7.3 m/s mean; 14.8 m/s fastest 2-minute | NOAA airport | Stronger gust trails and leaf bending. Direction and gust timing are authored. |
| Snow | 0.0 mm new; 0.0 mm ground depth | NOAA airport | Falling flakes; retained ground cover follows model snow-water storage. |
| Day length | 9.2 hours | Calculated | Longer summer daylight and shorter winter daylight inside the visual cycle. |
| Air quality | 34 · Good · PM2.5-24hr | AirNow preliminary | A category badge and optional abstract veil. AQI does not measure visible haze or plant injury. |
| Plant season | dormant; canopy 0.0 %; buds 0.0 %; expansion 0.0 % | Teaching model | Opening and size follow canopy; amber tissue follows autumn color. |
| Autumn | colored 0.0 %; fallen 0.0 % | Teaching model | Seasonal amber tone and a smaller remaining canopy. |
| Root water | 119.6 mm; stress 0.0 % | Teaching model | Wet ground glow or dry soil marks, with the exact water meter beside the plant. |
| Snow & melt | 0.0 mm stored; 0.0 mm added; 0.0 mm melt | Teaching model | Pale ground cover and small melt ripples. |
| Water flows | 0.0 mm rain input; 0.0 mm runoff; 0.0 mm drainage | Teaching model | Water input feeds the root store; flow intensity adds low ground ripples. |
| Water loss | 0.2 mm plant ET; 0.8 mm reference ET | Teaching model | Sparse rising vapour. Loss is accumulated by the daily model, not the background clock. |
| Seasonal memory | 24 cool days; 0.0 heat units | Teaching model | Accumulated cooling and heat determine bud opening, rather than one warm frame. |
| Scenario & balance | 7.0 °C scenario midpoint; 0.000000 mm water residual | Teaching model | Scenario temperature drives thermal color; the residual checks the water balance. |
AirNow historical files (opens in a new tab) · Data definitions (opens in a new tab). Missing AQI dates remain unknown. This is the 2025 archive, not current air quality.
About the data & plant model
Weather: NOAA Philadelphia airport daily records, 2025. The temperature curve is the midpoint of the recorded daily low and high. A warmer year changes the temperature only; recorded precipitation and wind stay as they were.
Root water, seasonal stage and canopy come from the existing uncalibrated teaching model. The plant is My plant reference art driven by that generic model, not your individual. Rain, snow, lighting and movement illustrate a day; they do not reconstruct an hourly storm or forecast your plant. Humidity, cloud cover and wind direction are unknown.
Playback reads the saved daily trajectory. Changing speed or dragging the timeline does not rewrite your first idea or new idea.
A red maple’s conditions
- Look
- Test
- Tune
Level 2 · Test Set by your age band
The model’s reasons, the ribbon and your plant’s site.
The plant–weather model runs 2025 at a site. Damage stays until the leaves fall. How 2025 felt and the stage’s hot days read this site too. This is a model. It can be wrong; your own visits are the real record.
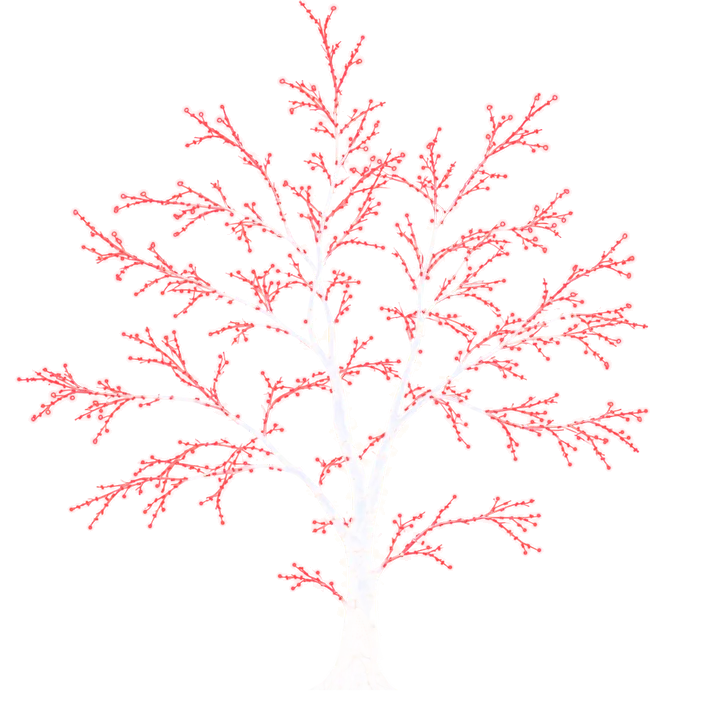
- Today’s high
- 10.0 °C
- Root-zone water
- 99 %of what the roots can reach
- Leaf cover
- 0 %of a full crown
- Storm Mild stress a gust of 45 mph
How do we know?
- Storm · Best guess: worked out from related species or how plants work in general.
Mild stress Strong stress Damage risk · Heat stress from 28 °C
Plant stress: weather that slows growth or harms leaves.
Model log: what the model computed, day by day
Model log
What the plant–weather model computed, day by day. Every number here comes from this run.
- January 1The stage’s day
- WeatherLow 3.9 °C, high 10.0 °C, no rain.
- Root zone0.0 mm in, 0.1 mm used by the tree and the soil (demand 0.7 mm), 99% of its available water left.
- ConditionStorm: Mild stress, from a gust of 45 mph.
This site’s numbers and where they come from
A lawn
- Water the roots can reach
- 204 mm A map
- Rain that reaches the roots
- 100% A best guess
- Shade
- 17% The example
- Wet ground
- No A map
- Soil pH 6.5 or higher
- No A map
- Weather station
- Philadelphia Intl Ap A map
An example site, not your plant’s. The example: values set for this example. A map: from public soil, land and flood maps. A best guess: a typical value until you or a map can say better.
Sources for this day and site
- NWS Mount Holly product criteria: wind advisory gusts 46–57 mph; high wind and severe thunderstorm 58 mph
- Hauer, Dawson & Werner 2006, Trees and Ice Storms, 2nd ed. (UW-Stevens Point; University of Illinois)
- Allen et al. 1998, FAO-56, ch. 8: total available water (Table 19 soil water)
- USDA NRCS SSURGO: available water storage 0–150 cm (aws0150wta)
- Morton Arboretum: chlorosis (red maple on high-pH soil; most plants take up iron and manganese best at pH 5.0–6.5)
- Smiley, Kielbaso & Nguyen 1986, J Arboric (most chlorotic red maples on soils of pH 6.6 and above)
- ACIS station metadata (nearest station with daily temperature and rain)
- USGS Annual NLCD 2025: impervious surface and tree canopy
Spring · leaf buds opening
Your plant and the model
Your My plant visits beside the teaching model. Nothing here changes your record.
Explore more: how 2025 felt for this plant
Inside the model & earlier notebook
The weather is observed. The plant is a teaching model, not a measured or forecast plant. One year cannot establish a climate trend.
Earlier warmer-year notebook
This notebook takes no new records. What you saved here stays: read it, download it or restore a backup. Your new visits and ideas go in My plant.
Student & teacher guide · Browser storage only. Download a copy after each visit.
Start here · a worked observation example
Illustrative example, not a field record: “On the same lower branch, two leaves have yellow edges; buds were not checked; the surface soil looks dry.” This is evidence. “The tree may be under water stress” is an explanation, not a measurement.
Before running the model, predict a change and say what could challenge it. Afterward, check whether the dates, plant, soil, shade and weather are comparable. Yellowing may also reflect the season, nutrition or damage. No visible change is a valid finding.
A mismatch may come from a model assumption, missing site information, an uncertain measurement, or your explanation. The simulation is not an answer key. Return to the same plant to test a revised explanation.
First look (A) · before the model
Save a visit before seeing model output. Each saved visit keeps its own A/B pair and prediction. Link a return to an earlier visit before saving.
Record a new real-world visit · practice example
Compare a warmer year
Compare 2025 NOAA airport weather with a teaching model. Your first look (A) stays unchanged; your observations do not set exact model values.
Generic deciduous teaching model.
No species-specific model is available. This reference illustrates leaf timing and root-zone water; it is not a prediction for your plant.
Save your first look (A) to run the model.
New idea (B) · what changed in your thinking?
First check comparability. A different year or warmer year cannot prove your present observation was wrong. Plan a real return visit; add its evidence as a new observation.
Run the model to write a provisional new idea (B), or start a linked return from an earlier visit.
Save a first look (A) to start an evidence card.
Download your first look (A) and new idea (B)
A is your visit as you wrote it. B keeps that evidence and adds the model run, your new idea and a return plan. Files are downloaded to your device; submission to a class platform is a separate action.
Saved in this browser only. Keep downloaded copies after each visit. Practice records stay separate from field records.
Restore from a file
Choose an Xeed paired-data JSON file (schema 1 or 2, up to 20 MB). A preview appears before anything is added. Practice and field records stay separate; conflicting originals are never replaced.
Why these observation factors? · research & protocol
- Denny et al. (2014) (opens in a new tab): record each phenophase on the same individual; distinguish no, uncertain and not checked.
- Fuccillo et al. (2015) (opens in a new tab): use a common protocol and practice ambiguous plant stages.
- Quintana et al. (2004) (opens in a new tab) and Schwarz et al. (2009) (opens in a new tab): scaffold evidence, predictions, model evaluation and revision. This Xeed application still needs classroom testing.
- FAO-56 (opens in a new tab): temperature, radiation, humidity and wind inform evaporation. Not all are available or calibrated in this tree model.
- NOAA (opens in a new tab): keep short-term weather separate from long-term climate.
Inside the teaching model
Baseline on Jan 1, 2025 · dormantSpring readiness
0% leaf expansion
0 °C·days of spring warmth. Buds open at 340.
Root-zone water
119.6/ 120 mm
Water limitation: 0% relative index. This is an estimate with delayed recovery, not a sensor reading.
Autumn transition
0% color progress
0% modeled leaf fall. Shorter days and cooling accumulate; leaf loss follows later.
Today’s water, step by step
Every millimeter is accounted for
- Estimated rain / snow water input
- 0.00 / 0.00 mm
- Snow melt / retained snow water
- 0.00 / 0.00 mm
- Runoff / drainage
- 0.00 / 0.00 mm
- Reference ET₀ / modeled loss
- 0.80 / 0.16 mm
- Water balance residual
- 0.0e+0 mm
Rain/snow partition uses a daily temperature proxy. Observed snow depth is shown separately and is never added again as water.
What is assumed?
92 days from Oct–Dec 2024 initialize water and cooling history. Starting water is 72 mm; snow water is 0. These are assumptions, not field measurements.
Spring: once days are at least 10 hours long, each day adds its warmth above 0 °C. Buds open at 340 °C·days; leaves are full 630 later. Winter chill is not modelled. These spring numbers were fitted to red maples watched near Philadelphia in 2023 and 2024 (USA National Phenology Network). On years the fit never saw, a single tree was about two weeks off.
Autumn begins below 12 hours of daylight after midsummer. Cooling and shorter days accumulate a teaching score; leaf fall is delayed by 14 days. Autumn is not fitted.
Hargreaves reference ET uses temperature and calculated solar geometry. Soil freezing, irrigation, canopy interception, carbon, injury and death are omitted. Stress does not directly imply red leaves.
FAO-56 method reference (opens in a new tab)Earlier field visits (read-only)
One tree, the same viewpoint.
Red maple (Acer rubrum) is a candidate. A specific tree, species identification, safe access and teacher approval are still needed. The teaching model’s coefficients are not red-maple measurements.
- Choose a safely reachable tree with your teacher. Assign a non-identifying alias, such as School tree A.
- Use the same branch, camera position and scale reference. Do not cut, climb or mark the tree without permission.
- Check buds, unfolded leaves, colored leaves and falling leaves separately. Several events can overlap. “Not observed” is different from “no.”
- Record what is visible first, then your explanation. Keep an original dated photo separately and give it a reference here.
- Revisit weekly, more often near a transition if safe. Record missed visits; arrange a summer handover.
Worked example · invented: “On the same twig, a pale leaf edge is visible between bud scales; last week the scales were closed.” Record the visible evidence. “Warm weather caused it” is an explanation to investigate.
Real observations from another year can be compared for inquiry, but they do not validate the 2025 temperature counterfactual. New visits are recorded in My plant or in the Warmer-year notebook above; the visits saved here stay readable.
Read the species-specific USA-NPN definitions (opens in a new tab)No earlier visit is saved in this notebook.
Every day’s numbers (NOAA)
Source: NOAA GHCN-Daily station USW00013739 (opens in a new tab). Pinned on 2026-10-02; dataset 3.35-upd-2026093018. Nonblank quality-failure flags and missing values are rejected. Trace precipitation retains its flag, even when recorded as zero.
“Midpoint” means (low + high) / 2, not an observed daily mean. Station date labels and reporting windows are retained; this is not an hourly replay. Solid temperature values are derived from observations; water and canopy values are model estimates.
| Date | Low °C | High °C | Precip. mm | Model water mm | Model canopy % |
|---|---|---|---|---|---|
| 2025-01-01 | 3.9 | 10.0 | 0.0 | 119.58 | 0.0 |
| 2025-01-02 | 1.7 | 6.1 | 0.0 | 119.46 | 0.0 |
| 2025-01-03 | -1.0 | 2.2 | 0.3 | 119.67 | 0.0 |
| 2025-01-04 | -2.7 | 0.0 | 0.0 | 119.60 | 0.0 |
| 2025-01-05 | -5.5 | 0.0 | 0.0 | 119.51 | 0.0 |
| 2025-01-06 | -4.3 | -1.0 | 2.8 | 119.43 | 0.0 |
| 2025-01-07 | -7.1 | 1.1 | 0.0 | 119.32 | 0.0 |
| 2025-01-08 | -5.5 | -0.5 | 0.0 | 119.23 | 0.0 |
| 2025-01-09 | -6.6 | 1.1 | 0.0 | 119.12 | 0.0 |
| 2025-01-10 | -3.8 | 2.8 | 0.0 | 119.00 | 0.0 |
| 2025-01-11 | -2.7 | 1.1 | 0.5 | 118.95 | 0.0 |
| 2025-01-12 | -2.7 | 6.1 | 0.0 | 119.84 | 0.0 |
| 2025-01-13 | -1.6 | 7.2 | 0.0 | 119.67 | 0.0 |
| 2025-01-14 | -4.3 | 1.7 | 0.0 | 119.56 | 0.0 |
| 2025-01-15 | -5.5 | 1.1 | 0.0 | 119.44 | 0.0 |
| 2025-01-16 | -7.1 | -1.6 | 0.5 | 119.35 | 0.0 |
| 2025-01-17 | -4.3 | 6.7 | 0.0 | 119.67 | 0.0 |
| 2025-01-18 | -2.7 | 5.6 | 0.8 | 119.84 | 0.0 |
| 2025-01-19 | -4.9 | 3.9 | 5.1 | 119.85 | 0.0 |
| 2025-01-20 | -10.5 | -3.2 | 0.0 | 119.76 | 0.0 |
| 2025-01-21 | -12.1 | -7.1 | 0.0 | 119.71 | 0.0 |
| 2025-01-22 | -11.6 | -6.6 | 0.0 | 119.65 | 0.0 |
| 2025-01-23 | -11.6 | -2.7 | 0.0 | 119.55 | 0.0 |
| 2025-01-24 | -8.2 | 1.1 | 0.0 | 119.42 | 0.0 |
| 2025-01-25 | -8.2 | 2.2 | 0.0 | 119.27 | 0.0 |
| 2025-01-26 | -3.2 | 5.6 | 0.0 | 119.82 | 0.0 |
| 2025-01-27 | -4.9 | 7.8 | 0.0 | 119.78 | 0.0 |
| 2025-01-28 | -1.0 | 7.2 | 0.0 | 119.59 | 0.0 |
| 2025-01-29 | -1.6 | 11.7 | 0.0 | 119.33 | 0.0 |
| 2025-01-30 | -1.6 | 5.6 | 0.0 | 119.15 | 0.0 |
| 2025-01-31 | 2.2 | 10.6 | 13.7 | 119.77 | 0.0 |
| 2025-02-01 | -4.9 | 10.0 | 0.5 | 119.74 | 0.0 |
| 2025-02-02 | -7.1 | 3.3 | 0.3 | 119.57 | 0.0 |
| 2025-02-03 | -2.1 | 11.1 | 0.0 | 119.60 | 0.0 |
| 2025-02-04 | 0.0 | 10.0 | 0.0 | 119.35 | 0.0 |
| 2025-02-05 | -0.5 | 2.8 | Trace (0) | 119.23 | 0.0 |
| 2025-02-06 | -0.5 | 3.9 | 7.1 | 119.86 | 0.0 |
| 2025-02-07 | -2.1 | 7.8 | 0.0 | 119.63 | 0.0 |
| 2025-02-08 | -3.2 | 1.7 | 6.1 | 119.87 | 0.0 |
| 2025-02-09 | -0.5 | 3.9 | Trace (0) | 119.85 | 0.0 |
| 2025-02-10 | -1.6 | 5.0 | 0.0 | 119.82 | 0.0 |
| 2025-02-11 | -2.7 | 2.8 | 7.1 | 119.85 | 0.0 |
| 2025-02-12 | -1.0 | 2.2 | 4.6 | 119.88 | 0.0 |
| 2025-02-13 | 1.7 | 9.4 | 1.8 | 119.76 | 0.0 |
| 2025-02-14 | -1.6 | 3.3 | 0.0 | 119.60 | 0.0 |
| 2025-02-15 | -2.1 | 4.4 | 10.2 | 119.81 | 0.0 |
| 2025-02-16 | 1.7 | 15.0 | 13.7 | 119.63 | 0.0 |
| 2025-02-17 | -2.1 | 3.3 | 0.0 | 119.46 | 0.0 |
| 2025-02-18 | -6.6 | -2.1 | 0.0 | 119.35 | 0.0 |
| 2025-02-19 | -8.8 | -1.0 | 0.0 | 119.20 | 0.0 |
| 2025-02-20 | -7.1 | -2.1 | 0.3 | 119.09 | 0.0 |
| 2025-02-21 | -4.9 | 3.3 | 0.0 | 118.89 | 0.0 |
| 2025-02-22 | -6.0 | 5.0 | 0.0 | 118.65 | 0.0 |
| 2025-02-23 | -3.2 | 9.4 | 0.0 | 118.64 | 0.0 |
| 2025-02-24 | -2.1 | 12.8 | 0.0 | 118.26 | 0.0 |
| 2025-02-25 | 2.8 | 15.0 | 0.0 | 117.86 | 0.0 |
| 2025-02-26 | 1.7 | 16.1 | 0.0 | 117.42 | 0.0 |
| 2025-02-27 | 5.6 | 12.2 | 0.5 | 117.62 | 0.0 |
| 2025-02-28 | 2.8 | 11.1 | 0.0 | 117.31 | 0.0 |
| 2025-03-01 | -1.6 | 18.9 | 0.0 | 116.77 | 0.0 |
| 2025-03-02 | -6.6 | 2.8 | 0.0 | 116.56 | 0.0 |
| 2025-03-03 | -4.3 | 5.0 | 0.0 | 116.30 | 0.0 |
| 2025-03-04 | -1.6 | 17.2 | 0.0 | 115.79 | 0.0 |
| 2025-03-05 | 9.4 | 16.7 | 39.1 | 119.61 | 0.0 |
| 2025-03-06 | 2.8 | 13.9 | 0.0 | 119.20 | 0.0 |
| 2025-03-07 | 1.7 | 11.7 | 0.0 | 118.84 | 0.0 |
| 2025-03-08 | 3.3 | 10.6 | Trace (0) | 118.52 | 0.0 |
| 2025-03-09 | -1.0 | 13.3 | 0.0 | 118.08 | 0.0 |
| 2025-03-10 | 3.3 | 20.0 | 0.0 | 117.49 | 0.0 |
| 2025-03-11 | 1.7 | 20.0 | 0.0 | 116.89 | 0.0 |
| 2025-03-12 | 4.4 | 17.8 | 0.0 | 116.36 | 0.0 |
| 2025-03-13 | 3.3 | 13.9 | 0.0 | 115.93 | 0.0 |
| 2025-03-14 | 5.6 | 16.7 | 0.0 | 115.44 | 0.0 |
| 2025-03-15 | 5.0 | 12.8 | 0.0 | 115.05 | 0.0 |
| 2025-03-16 | 10.0 | 21.1 | 13.5 | 119.43 | 0.0 |
| 2025-03-17 | 2.2 | 16.7 | 22.6 | 119.46 | 0.0 |
| 2025-03-18 | 0.6 | 17.8 | 0.0 | 118.87 | 0.0 |
| 2025-03-19 | 2.8 | 22.2 | 0.0 | 118.16 | 0.0 |
| 2025-03-20 | 7.2 | 22.2 | 14.7 | 119.32 | 0.0 |
| 2025-03-21 | 4.4 | 12.8 | Trace (0) | 118.91 | 0.0 |
| 2025-03-22 | 3.9 | 18.3 | Trace (0) | 118.31 | 0.0 |
| 2025-03-23 | 1.1 | 10.0 | 1.0 | 118.93 | 0.0 |
| 2025-03-24 | 4.4 | 12.2 | 13.0 | 119.60 | 0.0 |
| 2025-03-25 | 7.8 | 16.7 | Trace (0) | 119.09 | 0.0 |
| 2025-03-26 | 3.9 | 11.1 | 0.0 | 118.71 | 0.0 |
| 2025-03-27 | 0.6 | 12.2 | 0.0 | 118.24 | 0.0 |
| 2025-03-28 | 5.6 | 17.8 | Trace (0) | 117.65 | 0.0 |
| 2025-03-29 | 8.3 | 26.1 | 0.0 | 116.75 | 1.3 |
| 2025-03-30 | 7.2 | 20.0 | 0.0 | 116.01 | 3.4 |
| 2025-03-31 | 10.0 | 27.8 | 32.3 | 118.86 | 6.4 |
| 2025-04-01 | 6.7 | 16.7 | 4.1 | 119.26 | 8.3 |
| 2025-04-02 | 3.3 | 13.9 | 0.5 | 119.05 | 9.7 |
| 2025-04-03 | 8.9 | 24.4 | 1.0 | 118.78 | 12.3 |
| 2025-04-04 | 15.6 | 21.7 | 22.4 | 119.12 | 15.3 |
| 2025-04-05 | 9.4 | 16.7 | 0.5 | 118.76 | 17.3 |
| 2025-04-06 | 8.9 | 12.8 | 0.5 | 118.65 | 19.1 |
| 2025-04-07 | 5.0 | 10.6 | 7.1 | 119.32 | 20.3 |
| 2025-04-08 | 3.3 | 8.9 | 0.0 | 118.67 | 21.3 |
| 2025-04-09 | 0.6 | 10.0 | 0.0 | 117.83 | 22.1 |
| 2025-04-10 | 5.6 | 12.2 | Trace (0) | 116.99 | 23.5 |
| 2025-04-11 | 5.6 | 8.9 | 31.5 | 119.43 | 24.7 |
| 2025-04-12 | 3.3 | 7.2 | 3.6 | 119.41 | 25.5 |
| 2025-04-13 | 5.6 | 16.7 | 0.0 | 118.11 | 27.3 |
| 2025-04-14 | 6.7 | 21.1 | Trace (0) | 116.42 | 29.5 |
| 2025-04-15 | 8.9 | 20.6 | Trace (0) | 114.77 | 31.8 |
| 2025-04-16 | 6.7 | 13.9 | 0.0 | 113.61 | 33.5 |
| 2025-04-17 | 2.8 | 17.2 | 0.0 | 111.94 | 35.0 |
| 2025-04-18 | 5.6 | 22.2 | 0.0 | 109.81 | 37.3 |
| 2025-04-19 | 17.2 | 26.7 | 0.0 | 107.66 | 40.7 |
| 2025-04-20 | 10.6 | 22.8 | 0.0 | 105.45 | 43.4 |
| 2025-04-21 | 10.0 | 18.9 | Trace (0) | 103.62 | 45.7 |
| 2025-04-22 | 11.7 | 26.7 | 0.0 | 100.75 | 48.7 |
| 2025-04-23 | 12.2 | 25.0 | 0.0 | 98.03 | 51.7 |
| 2025-04-24 | 10.0 | 26.1 | 0.0 | 94.90 | 54.5 |
| 2025-04-25 | 10.6 | 26.1 | Trace (0) | 91.67 | 57.5 |
| 2025-04-26 | 11.7 | 23.9 | 0.8 | 89.53 | 60.3 |
| 2025-04-27 | 10.0 | 22.2 | 0.0 | 86.64 | 62.8 |
| 2025-04-28 | 8.3 | 23.9 | 0.0 | 83.26 | 65.4 |
| 2025-04-29 | 10.0 | 28.3 | 0.0 | 79.11 | 68.4 |
| 2025-04-30 | 13.9 | 26.7 | Trace (0) | 75.40 | 71.7 |
| 2025-05-01 | 12.2 | 27.2 | 0.0 | 71.29 | 74.8 |
| 2025-05-02 | 15.0 | 30.0 | 0.0 | 66.71 | 78.4 |
| 2025-05-03 | 17.8 | 29.4 | 1.0 | 63.39 | 82.1 |
| 2025-05-04 | 17.2 | 22.8 | 3.0 | 63.56 | 85.3 |
| 2025-05-05 | 16.1 | 22.8 | Trace (0) | 60.41 | 88.4 |
| 2025-05-06 | 16.1 | 27.2 | 0.8 | 56.78 | 91.8 |
| 2025-05-07 | 15.6 | 23.9 | Trace (0) | 53.01 | 94.9 |
| 2025-05-08 | 15.0 | 27.2 | Trace (0) | 48.22 | 98.3 |
| 2025-05-09 | 10.6 | 17.8 | 4.6 | 49.75 | 100.0 |
| 2025-05-10 | 9.4 | 23.3 | 0.0 | 45.45 | 100.0 |
| 2025-05-11 | 12.8 | 27.8 | 0.0 | 40.88 | 100.0 |
| 2025-05-12 | 12.8 | 28.3 | 0.0 | 36.66 | 100.0 |
| 2025-05-13 | 16.7 | 21.7 | 7.1 | 41.28 | 100.0 |
| 2025-05-14 | 15.0 | 18.9 | 33.0 | 68.73 | 100.0 |
| 2025-05-15 | 17.2 | 25.0 | 0.8 | 65.48 | 100.0 |
| 2025-05-16 | 15.6 | 25.0 | 38.1 | 91.11 | 100.0 |
| 2025-05-17 | 16.7 | 30.0 | Trace (0) | 85.48 | 100.0 |
| 2025-05-18 | 17.8 | 25.0 | 0.0 | 81.53 | 100.0 |
| 2025-05-19 | 13.3 | 21.7 | 0.0 | 77.67 | 100.0 |
| 2025-05-20 | 10.0 | 20.6 | 0.0 | 73.60 | 100.0 |
| 2025-05-21 | 11.1 | 13.9 | 11.4 | 83.07 | 100.0 |
| 2025-05-22 | 10.6 | 13.3 | 14.2 | 95.42 | 100.0 |
| 2025-05-23 | 10.6 | 20.6 | Trace (0) | 91.40 | 100.0 |
| 2025-05-24 | 10.0 | 20.0 | Trace (0) | 87.44 | 100.0 |
| 2025-05-25 | 11.1 | 21.7 | 0.0 | 83.18 | 100.0 |
| 2025-05-26 | 11.7 | 23.9 | 0.0 | 78.41 | 100.0 |
| 2025-05-27 | 12.2 | 23.3 | 0.3 | 74.16 | 100.0 |
| 2025-05-28 | 11.7 | 15.0 | 19.6 | 91.59 | 100.0 |
| 2025-05-29 | 13.9 | 23.3 | 0.3 | 87.58 | 100.0 |
| 2025-05-30 | 17.2 | 26.1 | 22.4 | 105.44 | 100.0 |
| 2025-05-31 | 12.8 | 23.9 | 1.5 | 102.28 | 100.0 |
| 2025-06-01 | 11.1 | 21.7 | 0.0 | 97.97 | 100.0 |
| 2025-06-02 | 11.1 | 23.9 | 0.0 | 93.07 | 100.0 |
| 2025-06-03 | 13.9 | 27.8 | 0.0 | 87.47 | 100.0 |
| 2025-06-04 | 15.0 | 31.1 | 0.0 | 81.09 | 100.0 |
| 2025-06-05 | 18.9 | 30.6 | 0.0 | 75.42 | 100.0 |
| 2025-06-06 | 19.4 | 30.6 | 0.0 | 69.84 | 100.0 |
| 2025-06-07 | 20.6 | 27.2 | 4.1 | 69.76 | 100.0 |
| 2025-06-08 | 17.2 | 23.3 | 0.3 | 66.38 | 100.0 |
| 2025-06-09 | 17.2 | 23.3 | 1.0 | 63.71 | 100.0 |
| 2025-06-10 | 17.8 | 28.9 | 3.0 | 61.34 | 100.0 |
| 2025-06-11 | 19.4 | 29.4 | 0.0 | 56.11 | 100.0 |
| 2025-06-12 | 20.0 | 33.3 | 0.0 | 49.76 | 100.0 |
| 2025-06-13 | 21.1 | 28.3 | 0.0 | 45.64 | 100.0 |
| 2025-06-14 | 16.7 | 21.1 | 0.5 | 43.56 | 100.0 |
| 2025-06-15 | 15.0 | 18.3 | 7.9 | 49.12 | 100.0 |
| 2025-06-16 | 16.1 | 19.4 | 0.8 | 47.57 | 100.0 |
| 2025-06-17 | 17.2 | 26.1 | Trace (0) | 43.50 | 100.0 |
| 2025-06-18 | 21.1 | 30.0 | 1.5 | 40.76 | 100.0 |
| 2025-06-19 | 22.2 | 33.9 | 9.9 | 44.88 | 100.0 |
| 2025-06-20 | 19.4 | 30.0 | 0.0 | 40.36 | 100.0 |
| 2025-06-21 | 22.2 | 32.8 | 0.0 | 36.03 | 100.0 |
| 2025-06-22 | 23.9 | 31.1 | 0.3 | 33.12 | 100.0 |
| 2025-06-23 | 25.0 | 37.2 | 0.0 | 29.01 | 100.0 |
| 2025-06-24 | 26.7 | 38.3 | 0.0 | 25.39 | 100.0 |
| 2025-06-25 | 25.0 | 37.2 | 3.3 | 25.13 | 100.0 |
| 2025-06-26 | 18.9 | 33.3 | 2.3 | 24.11 | 100.0 |
| 2025-06-27 | 17.8 | 22.2 | Trace (0) | 22.72 | 100.0 |
| 2025-06-28 | 17.8 | 31.1 | 0.3 | 20.45 | 100.0 |
| 2025-06-29 | 24.4 | 33.9 | 0.0 | 18.30 | 100.0 |
| 2025-06-30 | 23.9 | 34.4 | 20.8 | 34.79 | 100.0 |
| 2025-07-01 | 23.3 | 33.9 | 20.1 | 48.99 | 100.0 |
| 2025-07-02 | 22.2 | 30.6 | 1.5 | 45.81 | 100.0 |
| 2025-07-03 | 21.7 | 33.3 | 2.8 | 43.19 | 100.0 |
| 2025-07-04 | 20.0 | 29.4 | 0.0 | 39.13 | 100.0 |
| 2025-07-05 | 18.9 | 31.1 | 0.0 | 34.91 | 100.0 |
| 2025-07-06 | 21.7 | 32.2 | 0.0 | 31.27 | 100.0 |
| 2025-07-07 | 24.4 | 32.8 | 0.3 | 28.52 | 100.0 |
| 2025-07-08 | 23.3 | 35.6 | 26.4 | 48.49 | 100.0 |
| 2025-07-09 | 22.2 | 32.8 | 21.3 | 64.08 | 100.0 |
| 2025-07-10 | 22.2 | 30.0 | 0.0 | 59.35 | 100.0 |
| 2025-07-11 | 22.8 | 32.2 | 0.0 | 53.99 | 100.0 |
| 2025-07-12 | 23.3 | 32.8 | 0.0 | 48.55 | 100.0 |
| 2025-07-13 | 23.9 | 33.3 | 0.0 | 43.63 | 100.0 |
| 2025-07-14 | 23.9 | 32.8 | 4.3 | 43.24 | 100.0 |
| 2025-07-15 | 23.9 | 32.2 | Trace (0) | 39.19 | 100.0 |
| 2025-07-16 | 24.4 | 32.8 | 3.0 | 38.18 | 100.0 |
| 2025-07-17 | 23.9 | 35.0 | 1.8 | 35.53 | 100.0 |
| 2025-07-18 | 24.4 | 29.4 | 0.0 | 33.03 | 100.0 |
| 2025-07-19 | 23.9 | 27.8 | 0.5 | 31.50 | 100.0 |
| 2025-07-20 | 24.4 | 32.8 | 0.0 | 28.53 | 100.0 |
| 2025-07-21 | 22.8 | 31.7 | 0.0 | 25.85 | 100.0 |
| 2025-07-22 | 20.0 | 30.0 | 0.0 | 23.41 | 100.0 |
| 2025-07-23 | 20.6 | 30.0 | 0.0 | 21.26 | 100.0 |
| 2025-07-24 | 20.6 | 32.2 | 0.0 | 19.04 | 100.0 |
| 2025-07-25 | 24.4 | 36.7 | 8.6 | 24.40 | 100.0 |
| 2025-07-26 | 23.9 | 31.1 | Trace (0) | 22.35 | 100.0 |
| 2025-07-27 | 22.2 | 32.8 | 8.9 | 28.08 | 100.0 |
| 2025-07-28 | 24.4 | 34.4 | 0.0 | 25.21 | 100.0 |
| 2025-07-29 | 26.1 | 36.7 | 0.0 | 22.45 | 100.0 |
| 2025-07-30 | 25.6 | 36.1 | 0.0 | 20.04 | 100.0 |
| 2025-07-31 | 21.1 | 33.9 | 17.5 | 33.41 | 100.0 |
| 2025-08-01 | 18.9 | 22.8 | Trace (0) | 31.69 | 100.0 |
| 2025-08-02 | 17.8 | 28.3 | 0.0 | 28.86 | 100.0 |
| 2025-08-03 | 17.8 | 29.4 | 0.0 | 26.13 | 100.0 |
| 2025-08-04 | 18.3 | 31.7 | 0.0 | 23.39 | 100.0 |
| 2025-08-05 | 20.6 | 29.4 | 0.0 | 21.42 | 100.0 |
| 2025-08-06 | 21.1 | 26.1 | Trace (0) | 20.10 | 100.0 |
| 2025-08-07 | 18.9 | 28.9 | 0.0 | 18.35 | 100.0 |
| 2025-08-08 | 17.2 | 29.4 | 0.0 | 16.62 | 100.0 |
| 2025-08-09 | 16.7 | 30.6 | 0.0 | 14.93 | 100.0 |
| 2025-08-10 | 17.8 | 31.1 | 0.0 | 13.43 | 100.0 |
| 2025-08-11 | 19.4 | 31.1 | 0.0 | 12.15 | 100.0 |
| 2025-08-12 | 22.2 | 32.2 | 0.0 | 11.03 | 100.0 |
| 2025-08-13 | 23.9 | 33.3 | 2.5 | 12.29 | 100.0 |
| 2025-08-14 | 23.3 | 32.8 | 0.0 | 11.18 | 100.0 |
| 2025-08-15 | 23.9 | 34.4 | 0.0 | 10.10 | 100.0 |
| 2025-08-16 | 23.9 | 32.2 | 0.0 | 9.25 | 100.0 |
| 2025-08-17 | 23.3 | 33.9 | 36.3 | 35.51 | 100.0 |
| 2025-08-18 | 18.3 | 25.0 | 1.5 | 34.64 | 100.0 |
| 2025-08-19 | 20.0 | 26.1 | Trace (0) | 32.45 | 100.0 |
| 2025-08-20 | 17.8 | 23.3 | 2.3 | 32.81 | 100.0 |
| 2025-08-21 | 16.7 | 23.3 | 1.3 | 32.07 | 100.0 |
| 2025-08-22 | 16.1 | 28.9 | 0.0 | 29.23 | 100.0 |
| 2025-08-23 | 17.8 | 28.9 | 0.0 | 26.78 | 100.0 |
| 2025-08-24 | 17.8 | 29.4 | 0.0 | 24.49 | 100.0 |
| 2025-08-25 | 21.1 | 30.0 | 0.0 | 22.57 | 100.0 |
| 2025-08-26 | 17.8 | 26.7 | 0.0 | 20.95 | 100.0 |
| 2025-08-27 | 15.6 | 25.6 | 0.0 | 19.44 | 100.0 |
| 2025-08-28 | 15.0 | 26.7 | Trace (0) | 17.91 | 100.0 |
| 2025-08-29 | 17.2 | 26.7 | 0.0 | 16.62 | 100.0 |
| 2025-08-30 | 13.9 | 25.0 | 0.0 | 15.41 | 100.0 |
| 2025-08-31 | 13.9 | 27.2 | 0.0 | 14.16 | 100.0 |
| 2025-09-01 | 16.7 | 27.8 | 0.0 | 13.07 | 100.0 |
| 2025-09-02 | 16.1 | 27.2 | 0.3 | 12.36 | 100.0 |
| 2025-09-03 | 15.6 | 27.8 | 0.0 | 11.39 | 100.0 |
| 2025-09-04 | 17.8 | 29.4 | 0.5 | 10.94 | 100.0 |
| 2025-09-05 | 20.0 | 31.1 | 0.0 | 10.05 | 100.0 |
| 2025-09-06 | 20.6 | 32.2 | 2.8 | 11.77 | 100.0 |
| 2025-09-07 | 17.2 | 25.0 | 10.7 | 21.12 | 100.0 |
| 2025-09-08 | 13.3 | 25.0 | 0.0 | 19.65 | 100.0 |
| 2025-09-09 | 13.9 | 25.0 | 0.0 | 18.32 | 100.0 |
| 2025-09-10 | 18.3 | 22.2 | Trace (0) | 17.57 | 100.0 |
| 2025-09-11 | 17.8 | 28.3 | 0.0 | 16.32 | 100.0 |
| 2025-09-12 | 16.1 | 28.9 | 0.0 | 15.07 | 100.0 |
| 2025-09-13 | 17.8 | 28.3 | 0.0 | 14.01 | 100.0 |
| 2025-09-14 | 18.3 | 31.1 | 0.0 | 12.89 | 100.0 |
| 2025-09-15 | 18.3 | 29.4 | 0.0 | 11.96 | 100.0 |
| 2025-09-16 | 17.8 | 25.6 | 0.5 | 11.75 | 100.0 |
| 2025-09-17 | 18.3 | 22.8 | 11.4 | 22.19 | 100.0 |
| 2025-09-18 | 18.9 | 28.9 | Trace (0) | 20.70 | 100.0 |
| 2025-09-19 | 18.9 | 31.7 | 0.0 | 19.09 | 100.0 |
| 2025-09-20 | 16.7 | 26.1 | 0.0 | 17.95 | 100.0 |
| 2025-09-21 | 15.0 | 25.0 | 0.0 | 16.88 | 100.0 |
| 2025-09-22 | 13.9 | 25.6 | 0.0 | 15.82 | 100.0 |
| 2025-09-23 | 18.3 | 30.0 | 2.5 | 17.04 | 100.0 |
| 2025-09-24 | 20.0 | 26.7 | 6.1 | 21.95 | 100.0 |
| 2025-09-25 | 21.1 | 28.9 | 2.8 | 23.34 | 100.0 |
| 2025-09-26 | 20.6 | 28.9 | 0.0 | 21.99 | 100.0 |
| 2025-09-27 | 19.4 | 27.8 | 3.6 | 24.15 | 100.0 |
| 2025-09-28 | 18.3 | 30.0 | 4.3 | 26.55 | 100.0 |
| 2025-09-29 | 20.0 | 27.2 | 0.0 | 25.19 | 100.0 |
| 2025-09-30 | 19.4 | 28.3 | 0.0 | 23.77 | 100.0 |
| 2025-10-01 | 13.9 | 23.3 | 0.0 | 22.57 | 100.0 |
| 2025-10-02 | 12.2 | 22.2 | 0.0 | 21.45 | 100.0 |
| 2025-10-03 | 11.1 | 22.2 | 0.0 | 20.36 | 100.0 |
| 2025-10-04 | 13.3 | 27.8 | 0.0 | 19.06 | 100.0 |
| 2025-10-05 | 15.6 | 28.3 | 0.0 | 17.89 | 99.8 |
| 2025-10-06 | 15.6 | 27.8 | 0.0 | 16.83 | 99.6 |
| 2025-10-07 | 17.8 | 27.8 | Trace (0) | 15.92 | 99.3 |
| 2025-10-08 | 13.9 | 22.8 | 8.9 | 23.70 | 99.0 |
| 2025-10-09 | 9.4 | 18.9 | 0.0 | 22.74 | 98.6 |
| 2025-10-10 | 7.2 | 18.3 | 0.0 | 21.80 | 98.0 |
| 2025-10-11 | 11.1 | 19.4 | 1.5 | 22.41 | 97.5 |
| 2025-10-12 | 13.9 | 18.3 | 0.3 | 22.07 | 96.8 |
| 2025-10-13 | 13.3 | 16.1 | 4.6 | 26.11 | 96.1 |
| 2025-10-14 | 12.2 | 21.7 | Trace (0) | 25.04 | 95.3 |
| 2025-10-15 | 12.2 | 22.2 | 0.0 | 24.01 | 94.5 |
| 2025-10-16 | 8.3 | 17.8 | 0.0 | 23.17 | 93.3 |
| 2025-10-17 | 7.8 | 19.4 | 0.0 | 22.28 | 92.1 |
| 2025-10-18 | 8.9 | 22.2 | 0.0 | 21.33 | 90.9 |
| 2025-10-19 | 11.1 | 25.0 | 0.0 | 20.34 | 89.7 |
| 2025-10-20 | 11.7 | 21.1 | 1.5 | 21.07 | 88.3 |
| 2025-10-21 | 8.3 | 22.2 | 3.3 | 23.39 | 86.8 |
| 2025-10-22 | 12.2 | 18.9 | 0.5 | 23.23 | 85.2 |
| 2025-10-23 | 9.4 | 17.2 | 0.0 | 22.60 | 83.2 |
| 2025-10-24 | 7.2 | 16.1 | 0.0 | 22.00 | 80.8 |
| 2025-10-25 | 6.7 | 16.7 | 0.0 | 21.40 | 78.2 |
| 2025-10-26 | 7.2 | 17.8 | 0.0 | 20.81 | 75.5 |
| 2025-10-27 | 6.1 | 16.1 | 0.0 | 20.30 | 72.5 |
| 2025-10-28 | 6.7 | 13.9 | 0.0 | 19.91 | 69.0 |
| 2025-10-29 | 9.4 | 16.1 | 4.6 | 24.03 | 65.9 |
| 2025-10-30 | 11.7 | 21.7 | 26.2 | 48.95 | 63.0 |
| 2025-10-31 | 10.6 | 16.7 | 0.0 | 48.10 | 59.7 |
| 2025-11-01 | 8.3 | 17.2 | 0.0 | 47.17 | 56.1 |
| 2025-11-02 | 5.0 | 18.9 | 0.0 | 46.13 | 52.0 |
| 2025-11-03 | 7.2 | 15.0 | 0.0 | 45.43 | 47.5 |
| 2025-11-04 | 7.8 | 17.8 | 0.0 | 44.67 | 43.3 |
| 2025-11-05 | 5.6 | 21.1 | Trace (0) | 43.80 | 38.9 |
| 2025-11-06 | 5.0 | 15.6 | 0.0 | 43.21 | 33.6 |
| 2025-11-07 | 2.2 | 16.7 | 0.0 | 42.63 | 27.7 |
| 2025-11-08 | 11.7 | 20.6 | 2.3 | 44.40 | 23.3 |
| 2025-11-09 | 8.3 | 18.3 | 15.5 | 59.35 | 18.1 |
| 2025-11-10 | 2.8 | 14.4 | 0.8 | 59.73 | 11.2 |
| 2025-11-11 | 0.0 | 7.2 | 0.0 | 59.51 | 5.0 |
| 2025-11-12 | 4.4 | 13.3 | Trace (0) | 59.24 | 2.5 |
| 2025-11-13 | 5.6 | 12.2 | 0.0 | 59.02 | 0.0 |
| 2025-11-14 | 3.3 | 13.9 | Trace (0) | 58.76 | 0.0 |
| 2025-11-15 | 4.4 | 12.8 | 0.0 | 58.52 | 0.0 |
| 2025-11-16 | 6.7 | 16.7 | Trace (0) | 58.24 | 0.0 |
| 2025-11-17 | 4.4 | 9.4 | 0.0 | 58.07 | 0.0 |
| 2025-11-18 | 1.7 | 9.4 | Trace (0) | 57.88 | 0.0 |
| 2025-11-19 | 5.0 | 8.3 | 9.1 | 66.85 | 0.0 |
| 2025-11-20 | 3.9 | 10.0 | 0.0 | 66.67 | 0.0 |
| 2025-11-21 | 8.3 | 12.8 | Trace (0) | 66.49 | 0.0 |
| 2025-11-22 | 5.6 | 11.7 | 8.9 | 75.20 | 0.0 |
| 2025-11-23 | 1.1 | 12.8 | 0.0 | 74.96 | 0.0 |
| 2025-11-24 | 3.9 | 12.8 | 0.0 | 74.74 | 0.0 |
| 2025-11-25 | 5.0 | 13.9 | 13.5 | 88.01 | 0.0 |
| 2025-11-26 | 8.3 | 17.2 | 7.1 | 94.86 | 0.0 |
| 2025-11-27 | 1.7 | 8.3 | 0.0 | 94.69 | 0.0 |
| 2025-11-28 | 0.6 | 6.1 | 0.0 | 94.56 | 0.0 |
| 2025-11-29 | -0.6 | 6.7 | 0.0 | 94.40 | 0.0 |
| 2025-11-30 | 1.7 | 6.1 | 1.3 | 95.58 | 0.0 |
| 2025-12-01 | 0.0 | 7.8 | 0.0 | 95.41 | 0.0 |
| 2025-12-02 | 0.0 | 5.6 | 22.6 | 117.88 | 0.0 |
| 2025-12-03 | 0.0 | 6.7 | 0.0 | 117.74 | 0.0 |
| 2025-12-04 | -1.7 | 6.1 | 0.0 | 117.59 | 0.0 |
| 2025-12-05 | -3.9 | 1.1 | Trace (0) | 117.49 | 0.0 |
| 2025-12-06 | -1.1 | 6.1 | 0.3 | 117.65 | 0.0 |
| 2025-12-07 | -1.7 | 6.1 | 0.0 | 117.50 | 0.0 |
| 2025-12-08 | -4.4 | 3.3 | 0.0 | 117.37 | 0.0 |
| 2025-12-09 | -7.8 | 1.7 | 0.0 | 117.26 | 0.0 |
| 2025-12-10 | 0.0 | 8.3 | 1.3 | 118.39 | 0.0 |
| 2025-12-11 | -1.7 | 5.0 | Trace (0) | 118.26 | 0.0 |
| 2025-12-12 | -3.9 | 3.3 | 0.0 | 118.14 | 0.0 |
| 2025-12-13 | -3.9 | 7.8 | 0.8 | 118.77 | 0.0 |
| 2025-12-14 | -6.1 | 1.7 | 11.7 | 118.66 | 0.0 |
| 2025-12-15 | -7.2 | -2.2 | Trace (0) | 118.58 | 0.0 |
| 2025-12-16 | -6.7 | 1.7 | 0.0 | 118.47 | 0.0 |
| 2025-12-17 | -3.3 | 7.8 | 0.0 | 119.83 | 0.0 |
| 2025-12-18 | -2.2 | 13.9 | 0.0 | 119.76 | 0.0 |
| 2025-12-19 | -0.6 | 16.1 | 37.6 | 119.73 | 0.0 |
| 2025-12-20 | -2.8 | 5.0 | 0.0 | 119.60 | 0.0 |
| 2025-12-21 | -0.6 | 8.9 | 0.0 | 119.43 | 0.0 |
| 2025-12-22 | -4.4 | 5.0 | 0.0 | 119.28 | 0.0 |
| 2025-12-23 | 1.7 | 5.0 | 1.0 | 119.90 | 0.0 |
| 2025-12-24 | 2.2 | 10.6 | 0.0 | 119.72 | 0.0 |
| 2025-12-25 | 0.0 | 11.7 | 0.0 | 119.52 | 0.0 |
| 2025-12-26 | -2.8 | 0.6 | 8.1 | 119.44 | 0.0 |
| 2025-12-27 | -1.7 | 1.1 | 0.3 | 119.47 | 0.0 |
| 2025-12-28 | -3.3 | 5.6 | Trace (0) | 119.85 | 0.0 |
| 2025-12-29 | 0.0 | 12.8 | 1.5 | 119.78 | 0.0 |
| 2025-12-30 | -1.7 | 1.7 | 0.0 | 119.69 | 0.0 |
| 2025-12-31 | -2.8 | 1.7 | Trace (0) | 119.60 | 0.0 |